| Daily Equity Report |  |
|
Welcome to the Sharenet Daily Equity Report Issue: 10 February 2011 20:00 |
|
Long term interest rates are typically a good predicator of market sentiment. These rates are closely followed and so it was interesting to see BCA Research make the comment yesterday that, “The recent breakout of the U.S. 10-year Treasury yield above 3½% is an important technical signal, highlighting that the macro backdrop is increasingly turning against the bond market.”
Chart US 10 year Treasury yields

Source: Yahoo
Short term interest rates are driven by central banks to either stimulate or curtail growth and inflation, while longer term rates are a clearer reflection of where the market sees inflation over time.
At major turning points the combined market has been wrong. 30 years ago US bonds were yielding 15% as lenders banked on high inflation. As US inflation trended down, so lenders adjusted long rates down in sympathy.
Now we are arguably at another inflection point. Should inflation prove to be difficult to contain, long term interest rates will have to continue to steadily adjust upwards. It will never be in a linear fashion, and so while there will be opportunities on a tactical basis, there is a good probability that this will not be the case strategically.
Graph: real effective funds rate

Against a likely backdrop of higher future inflation, the valuation of global bonds is not attractive, given that they love a low inflation or a steadily declining inflation environment.
The chart presented by BCA Research clearly indicates how the US quickly moved to negative real interest rates in 2008 in a direct attempt to pump liquidity into markets. There was a degree of normalisation in 2009, but as inflation started picking up in 2010, while at the same time that the US maintained near zero interest rates, the real rates turned negative again.
Despite the inflationary concerns across the developed market’s three main central banks, i.e. the US Federal Reserve, UK’s Bank of England and Europe’s, European Central Bank, are likely to hold rates at low levels until early 2012. There is an outside chance that the Bank of England jumps the gun in 2011, given its high inflation numbers.

Source: Wells Fargo Securities
If you are an investor that shares these views of higher inflationary pressure into the future, it is important to assess the composition of your asset allocation.
If you would like to set up a time to meet in order to discuss your portfolio and its positioning, please don't hesitate to contact us.
Kind regards
Ian de Lange
info@seedinvestments.co.za
www.seedinvestments.co.za
021 9144 966
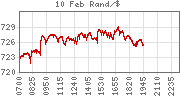
![[IMAGE]](image.php@width=300&cropratio=2%253A1&image=%252Fnews_images_sn%252F1295357754.jpg "Sandton City centre in Johannesburg at dusk") South Africa's rand fell more than 1.0 percent against the dollar on Thursday, hit by worse-than-expected local manufacturing data and tracking weaker emerging markets as investors avoided holding riskier assets. Full story |
A fall in South African thermal coal prices to $113 a tonne this week has started to draw out Indian buyers who have been sidelined since November, Indian traders said on Thursday. Full story A spike in iron ore prices lifted Kumba Iron Ore's full-year profit, with the company saying it expected prices to remain firm this year. Full story Revenue for the interim period ended 31 December 2010 increased to R322.4 million (2009: R249.2 million). Operating profit for the period was higher at R40.3 million (2009: R34.9 million). Attributable to equity holders of the parent rose slightly to R22.8 million (2009: R22.4 million). Head Full story |
![[IMAGE]](image.php@width=140&cropratio=4%253A3&image=%252Fnewsimages%252F2011-02-10T133419Z_01_AJOE71911P900_RTROPTP_3_OZABS-MINING-AFRICA-ANGLOCOAL-20110210.JPG "A coal merchant shovels coal at a coal yard in Melmerby, northern England") Anglo American's thermal coal unit is keen to expand its operations in South Africa and beyond, but is waiting for price. . . Full story | ![[IMAGE]](image.php@width=140&cropratio=4%253A3&image=%252Fnewsimages%252F2011-02-10T084539Z_01_AJOE7190OC500_RTROPTP_3_OZABS-TELKOM-20110210.JPG "South Africans make calls from a public phone bureau in Cape Town.") South Africa's Telkom will offer some of its workers voluntary severance packages and met with unions this week, as the struggling. . . Full story | ![[IMAGE]](image.php@width=140&cropratio=4%253A3&image=%252Fnewsimages%252F2011-02-10T111501Z_01_AJOE7190V9300_RTROPTP_3_OZABS-SAFRICA-MANUFACTURING-20110210.JPG "A shopkeeper waits in front of his stock at a shop in Soweto south west of Johannesburg") Growth in South Africa's manufacturing output slowed to just 0.2 percent on the year in December and was far below analysts. . . Full story | ![[IMAGE]](image.php@width=140&cropratio=4%253A3&image=%252Fnewsimages%252F2011-02-10T115045Z_01_AJOE7190WWN00_RTROPTP_3_OZABS-SAFRICA-RAND-20110210.JPG "A BANK TELLER LOOKS AT 50 AND 100 SOUTH AFRICAN RAND NOTES.") South Africa's rand fell over 1.0 percent against the dollar after worse-than-expected December manufacturing data on Thursday.. . . Full story |
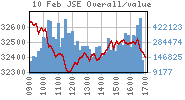
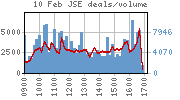
Trading Statistics
| Date | Adv. | Decl. | Unch. | Actives | Volume | Value | Trades | Orders |
|---|---|---|---|---|---|---|---|---|
| 10/02/2011 | 118 | 217 | 92 | 427 | 360,218,925 | R17,171,176,039 | 138620 | 2389912 |
| 09/02/2011 | 144 | 194 | 85 | 423 | 311,874,190 | R14,978,748,530 | 129431 | 2258278 |
| 08/02/2011 | 163 | 182 | 78 | 423 | 344,019,210 | R18,948,931,141 | 111610 | 2314393 |
| 07/02/2011 | 143 | 193 | 84 | 420 | 280,494,380 | R15,680,067,051 | 101137 | 2227435 |
| 04/02/2011 | 203 | 159 | 89 | 451 | 443,491,009 | R14,446,753,747 | 92270 | 2180737 |
 |  |  |
Major Moves Up
Click here for more Major Moves... |
Major Moves Down
Click here for more Major Moves... |
|||||||||||||||||||||||||||||||||||||||||||||||||||||||||||||||||||||||||||||||||||||||||||||||||||||||||||||||||||||||||||||||||||||||||||||||||||||||||||||||||||||||||||||||||||||||||||||||||||||||||||||||||||||||||||||||||||||||||||||||||||||||||||||
New Highs
Click here for more Major Moves... |
New Lows
Click here for more Major Moves... |
||||||||||||||||||||||
|
|
Click here for the Sharenet Spot Price page
|
|
Click here for the Sharenet Index Summary page
Latest Consensus Changes**
|
Results Expected**
|
Recent Dividends**
|
Ex Div**
|
Upcoming AGMs**
|
Click here for more SENS news