 |
The Sharenet Daily includes helpful charts that give a graphical impression of events, and our news content is sourced from a number of contributors, including Reuters. In addition, Sharenet's popular price information is available in our Spot Price format which provides a snapshot of the JSE and world indices, currencies and commodities.
All the JSE trading statistics; major movers; latest dividends; upcoming AGM dates and more are provided to insure that you keep abreast of market developments. The Sharenet Daily is published at 8pm each day on the website and also distributed via email for your convenience. As always, we welcome your comments, feedback and suggestions at support@sharenet.co.za


In previous months, inflation data has tended to surprise on the downside. I.e. monthly inflation has come in lower than analyst’s expectations. Today it was slightly higher than the consensus forecast. In March inflation rose by 1,2% against an expectation of 1%, and for the 12 months it rose 4,1% against a 4% consensus.
Consumer inflation
This inflation data had very little to no impact on either the equity market or the bond market.
The bond market break even inflation is running at around 6%. i.e. nominal bonds are pricing in inflation at the top end of the Reserve Bank’s inflation target. i.e. they are expecting a rise in inflation and interest rates to start being hiked later this year or beginning of 2012
Over 30 years, inflation in South Africa has run at just less than 10% per annum.
Gold
Gold bullion has continued to move up to new highs in most currency terms. Gold is quoted in US dollars. The price has now moved through the $1500/oz level.
The chart below reflects that although the rand is firm against the US dollar, in rand terms the price is now at R10190/oz. Against a backdrop of ongoing monetary stimulus, in general a lack of real interest rates, high inflationary expectations and downgrades to US debt outlook, the demand for gold has kept the price moving up steadily, especially over the last 10 years.
Looking back into history - gold in March 1971 traded at $38,87/oz and R27,65/oz. Over the 40 years the compounded growth in rands has been 15,9% to its current level. Over 30 years from near its peak the annual compounded return reduces to 11,45%.

If inflation was running at 10% over the last 30 years, then gold from its higher prices in early 1980’s has achieved annualised returns of only slightly ahead of inflation.
But over the last 10 years from its lower levels, gold, both in rand terms and in dollar terms has moved up very strongly.

With commodity assets becoming more common among investors as a means of achieving portfolio diversification, commodity assets under management have more than doubled between 2008 and 2010 to nearly US$380 billion - according to a recent World Gold Council report.
Gold is still relatively small in most commodity indices from 3% in the S&P Goldman Sachs Commodity Index to 7% in the Dow Jones UBS Commodity Index.
It is estimated that 168,300 tonnes of gold have been mined over the course of human history. 50% of this exists in the form of jewellery. Gold used in technology and dentistry and other fabrication accounts for 12%. Gold held in investments and official holdings (financial or investable) represent 36% of all above ground gold, or approximately 60,400 tonnes of gold.
Using the 2010 average price of $1224/oz, the size of financial gold holdings is equivalent to $2,4 trillion. The report puts this into context saying that this is larger than any single European sovereign debt market. But it does not represent any countries’ liability.
Total above ground stocks of gold in tonnes as of 2010

Naturally now one knows where this price can move to. Longer term the returns from gold should be ahead of inflation, but probably behind that of more riskier investments such as equities.
In a diversified portfolio we would advocate holding a portion of gold, and in the Seed Flexible Fund we have continued to hold a small allocation of just less than 5%.
Kind Regards
Ian de Lange
info@seedinvestments.co.za
www.seedinvestments.co.za
021 9144 966
![[IMAGE]](image.php@width=300&height=150&cropratio=2%253A1&image=%252Fnews_images_sn%252F1295529183.jpg "Man walks past the Johannesburg stock exchange offices in Sandton") South Africa's rand and mining stocks got a lift from record-high gold prices on Wednesday, while the broader stock market rebounded from a recent three-week low and tracked global markets higher. Full story ![[IMAGE]](image.php@width=300&height=150&cropratio=2%253A1&image=%252Fnewsimages%252F2011-04-20T144748Z_01_AJOE73J153Q00_RTROPTP_3_OZABS-SAFRICA-MARKETS-STOCKS-20110420.JPG "Electronic board displaying movements in major indices is seen at Johannesburg stock exchange in Sandton") South Africa's blue-chip index jumped more than 2 percent in late trade on Wednesday, tracking firmer global equity markets while higher commodity prices added to the positive sentiment. Full story |
 Syrians took to the streets in large numbers again Wednesday in the central city of Homs where activists say more than 20 pro-democracy protesters have been shot dead since Monday by soldiers and irregular forces. Full story  France promised Libyan rebels on Wednesday it would intensify air strikes on Muammar Gaddafi's forces and send military liaison officers to help them as fighting raged in the besieged city of Misrata. Full story 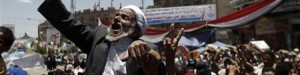 Gulf Arab states trying to mediate a transition of power in Yemen will send the UAE foreign minister to Sanaa within days, a Yemeni official said, but President Ali Abdullah Saleh again refused to quit quickly. Full story |
|
Markets |
Strong profits and outlooks
from tech and manufacturing companies propelled U.S. stocks
higher on Wednesday, delivering the biggest lift to sentiment
since quarterly earnings. . . Full story |
Upbeat earnings and outlooks
from companies including chipmaker Intel lifted global stocks
and fueled risk appetite on Wednesday, driving commodities
higher and the Australian. . . Full story |
Commodity stocks helped power
Britain's top share index sharply higher on Wednesday, while
earnings from Reckitt Benckiser and Home Retail, following U.S.
tech bellwether. . . Full story |
Gold rose above $1,500 an ounce
on Wednesday for the first time ever as the dollar wilted, oil
rose, worries over the U.S.. . . Full story | |||


European shares gained on
Wednesday, with technology stocks buoyed by strong results from
U.S. chip maker Intel ahead of Nokia's earnings on Thursday.. . . Full story |
Upbeat earnings from companies
including chip maker Intel lifted stocks and boosted appetite
for riskier assets on Wednesday, driving commodities higher and
the Australian. . . Full story |
European shares rose sharply
on Wednesday, tracking gains on Wall Street and in Asia, after
strong sales at tech bellwether Intel and. . . Full story |
Australian shares rose 1.4 percent on
Wednesday, nearly recouping Tuesday's loss, led by global miners BHP Billiton
and Rio Tinto as renewed. . . Full story | ||||


SA Business |
South Africa's government on Wednesday raised its forecast of maize output for the 2010/11 season to 10.883 million tonnes from 10.831. . . Full story |
South African inflation was higher than expected in March while retail sales growth for February slowed, suggesting the central bank will. . . Full story |
Harmony Gold's chief executive said on Wednesday the cost of developing its Wafi-Golpu prospect in Papua New Guinea could top initial. . . Full story |
Zambia expects to agree on higher electricity prices with mining companies this year in a move that is likely to increase. . . Full story | |||


South African inflation
was higher than expected in March while retail sales growth for
February slowed, suggesting the central bank will have to. . . Full story | South Africa has appointed Lungisa Fuzile as National Treasury's director general from May 16, Finance Minister Pravin Gordhan said on Wednesday.. . . Full story | Canadian gold and uranium producer First Uranium Corp said its South African tailings recovery unit has commissioned a storage facility a. . . Full story | South Africa's Treasury said on Wednesday it would issue 1.3 billion rand worth of the 2018 government bond and 800 million. . . Full story |
South African power utility Eskom said on Wednesday it had sold 300 million rand of its ES23 bond due in 2023 at a clearing yield of 9.155 percent.. . . Full story | South Africa's financial services industry watchdog FSB is drafting new capital rules for insurers, aimed at protecting consumers and strengthening the sector, the central bank said on Wednesday.. . . Full story | South Africa is planning to shift black economic empowerment (BEE) rules away from equity investment and ownership towards productive activities, Business Day newspaper reported on Wednesday.. . . Full story |
Company News |
Adcock shareholders were referred to the announcements released by Adcock on 10 December 2010 relating to the recommendation by the Medicines. . . Full story |
Shareholders were advised that on 19 April 2011 the company received the results of its arbitration hearing on its right to. . . Full story |
Shareholders were advised that on 19 April 2011 the company received the results of its arbitration hearing on its right to. . . Full story |
Shareholders were referred to the various SENS announcements, first published on 3 December 2009 and the last on 28 February 2011,. . . Full story | |||


At the forty-sixth annual general meeting of the shareholders of Zurich held on 20 April 2011, all the ordinary and special. . . Full story |
Shareholders are advised that EcoLife, the joint venture between Econet Wireless Zimbabwe, First Mutual Life Zimbabwe and Trustco Mobile ("Trustco Mobile"),. . . Full story |
Further to the cautionary announcement dated Monday, 24 January 2011, and the further cautionary announcement dated 8 March 2011, shareholders are. . . Full story |
Shareholders are referred to the cautionary announcements dated 18 May 2010, 3 June 2010, 3 August 2010, 27 October 2010, 7. . . Full story | ||||


Company Results | Gold and silver revenue for the quarter ended 31 march 2011 increased slightly to R655.9 million (2010: R655.6 million). Operating profit. . . Full story | Revenue rose to R14.8 million (R9.4 million), but trading loss worsened to R6.5 million (loss of R3.7 million). Profit attributable to. . . Full story | Revenue for the year ended 28 February 2010 increased by 13% to R7.4 billion (2010: R6.5 billion). Gross profit rose by. . . Full story | Revenue for the period ended 28 February 2011 increased to R1.6 billion (2010: R1.3 million). Operating profit grew to R124.4 million. . . Full story |
|
|
Click here for the Sharenet Spot Price page
| Date | Adv. | Decl. | Unch. | Actives | Volume | Value | Trades | Orders |
|---|---|---|---|---|---|---|---|---|
| 20/04/2011 | 229 | 108 | 61 | 398 | 330,373,534 | R13,333,978,657 | 94209 | 1985016 |
| 19/04/2011 | 214 | 127 | 83 | 424 | 263,324,515 | R11,531,658,381 | 100435 | 2163910 |
| 18/04/2011 | 86 | 275 | 70 | 431 | 309,928,429 | R13,037,551,462 | 103004 | 2255963 |
| 15/04/2011 | 138 | 165 | 97 | 400 | 314,291,948 | R11,231,575,882 | 92021 | 1900066 |
| 14/04/2011 | 149 | 168 | 91 | 408 | 262,351,618 | R12,143,488,835 | 103431 | 2026385 |
Major Moves Up
Click here for more Major Moves... |
Major Moves Down
Click here for more Major Moves... |
|||||||||||||||||||||||||||||||||||||||||||||||||||||||||||||||||||||||||||||||||||||||||||||||||||||||||||||||||||||||||||||||||||||||||||||||||||||||||||||||||||||||||||||||||||||||||||||||||||||||||||||||||||||||||||||||||||||||||||||||||||||||||||||
New Highs
Click here for more Major Moves... |
New Lows
Click here for more Major Moves... |
||||||||||||||||||||||||||||||||||||||||||||||||||
|
|
Click here for the Sharenet Index Summary page
Latest Consensus Changes**
|
Results Expected**
|
Recent Dividends**
|
Ex Div**
|
Upcoming AGMs**
|
| Date | Time | Headline |
| 20/04/2011 | 17:43 | Skinwell Holdings Limited - Trading statement |
| 20/04/2011 | 17:30 | Anglo American plc - Treasury Shares - Transfers |
| 20/04/2011 | 17:26 | Capitec Bank Holdings Limited - Dealing in securities by a director |
| 20/04/2011 | 17:23 | Adcock Ingram Holdings Limited - Update on the MCC resolution to |
| 20/04/2011 | 17:00 | Clover Industries Limited - Competition commission`s withdrawal |
| 20/04/2011 | 16:52 | Intertrading Limited - Trading statement |
| 20/04/2011 | 16:47 | Miranda Mineral Holdings Limited - Change in designation of directors |
| 20/04/2011 | 16:44 | PIK / PWK - Pick n Pay Stores / Pick n Pay Holdings - Results of the arbitration |
| 20/04/2011 | 16:15 | Sanlam Limited - Director`s dealings in Sanlam securities |
| 20/04/2011 | 16:14 | Sanlam Limited - Director`s dealings in Sanlam securities |
| 20/04/2011 | 16:13 | Sanlam Limited - Director`s dealings in Sanlam securities |
| 20/04/2011 | 16:12 | Sanlam Limited - Director`s dealings in Sanlam securities |
| 20/04/2011 | 16:11 | Conduit Capital Limited - Condensed consolidated unaudited results for |
| 20/04/2011 | 16:00 | Liberty Holdings Limited - Finalization of the acquisition by Liberty of a |
| 20/04/2011 | 15:58 | Zurich Insurance Company South Africa Limited - Report on proceedings at |
| 20/04/2011 | 15:50 | CCO - Capital & Counties Properties PLC - Notification of interim management |
| 20/04/2011 | 15:15 | SABMiller plc - SABMiller plc |
| 20/04/2011 | 15:00 | Wits Gold granted additional uranium rights in the DBM and Beisa North |
| 20/04/2011 | 14:50 | Trustco Group Holdings Limited - Voluntary announcement relating to |
| 20/04/2011 | 14:37 | Sekunjalo Investments Limited - Unaudited interim results for the period |
| 20/04/2011 | 13:03 | Resilient Property Income Fund Limited - Dealing in securities |
| 20/04/2011 | 12:52 | Micromega Holdings Limited - Further cautionary announcement |
| 20/04/2011 | 12:49 | Exxaro Resources Limited - Trading of Exxaro ordinary shares on behalf of |
| 20/04/2011 | 12:45 | Capitec Bank Holdings Limited - Dealing in securities by associates of a |
| 20/04/2011 | 12:38 | Exxaro Resources Limited - Acceptance of conditional awards granted in |
| 20/04/2011 | 12:33 | THEE - The Competition Commission - Commission withdraws case against Clover, |
| 20/04/2011 | 12:32 | Control Instruments Group Limited - Purchase of shares by directors |
| 20/04/2011 | 12:12 | Colliers South Africa Holdings Limited - Withdrawal of cautionary |
| 20/04/2011 | 11:42 | AngloGold Ashanti Limited - Anglogold Ashanti updates on North Africa |
| 20/04/2011 | 11:20 | Discovery Holdings Limited - Disclosure of dealing in securities by |
| 20/04/2011 | 11:18 | Tawana Resources NL - Notice of General Meeting |
| 20/04/2011 | 11:00 | SABMiller - Block listing six monthly return |
| 20/04/2011 | 10:09 | Intertrading Limited - Changes to the board of directors |
| 20/04/2011 | 09:57 | South African Coal Mining Holdings Limited - SRP appeal Committee |
| 20/04/2011 | 08:54 | Harmony Gold Mining Company Limited - Harmony hosting media on WAFI-GOLPU |
| 20/04/2011 | 08:22 | Sephaku Cement announces new project and confirms progress on track at |
| 20/04/2011 | 08:12 | Intertrading Limited - Renewal of cautionary annoucement |
| 20/04/2011 | 08:00 | Pretoria Portland Cement Company Limited - Trading statement |
| 20/04/2011 | 08:00 | Allied Technologies Limited - Summarised audited consolidated |
| 20/04/2011 | 08:00 | STX40 - SATRIX 40 Portfolio - Partial Delisting of Satrix 40 Securities |
| 20/04/2011 | 07:29 | First Uranium Corporation - Commissioning of tailings storage facility |
| 20/04/2011 | 07:15 | White Water Resources Limited - Cancellation of Prospecting Rights |
| 20/04/2011 | 07:10 | British American Tobacco p.l.c - Transaction in own shares |
| 20/04/2011 | 07:07 | BHP Billiton plc - BHP Billiton production report for the nine months |
| 20/04/2011 | 07:06 | BHP Billiton plc - BHP Billiton exploration and development report for |
| 20/04/2011 | 07:05 | BHP Billiton plc - Transaction in shares |
Click here for more SENS news